


![Can you Cook Eggs in the Microwave? [Complete Guide]](/assets/images/c1f79d1cad59f18f9b5dc31403bd0eb2.png)


For better or worse, the fast food industry continues to flourish in the US unlike anywhere else in the world. Some insiders refer to the fast food industry as the quick service restaurant (QSR) or limited service restaurant (LSR) industry.
No matter what you call it, there’s no denying that fast food consumption in US and international countries is a valuable business. In 2022, the industry was valued at a staggering $382B in the United States alone.
But why is America known for fast food by countries all over the world? Part of it goes back to the fact that many of the most established fast food chains on the planet originated in the US.
McDonald’s now has restaurants in over 100 different countries, while Subway claims to have restaurants in more countries than any other restaurant chain in the world. Eating at KFC has even become an annual Christmas tradition in Japan.
But throughout this article, we’ll be focusing on fast food consumption in US consumers. We’ll fill you in on the biggest restaurant chains in America, which states have the most fast food restaurants, and even which demographics eat fast food the most.
What is the biggest fast-food chain in America?
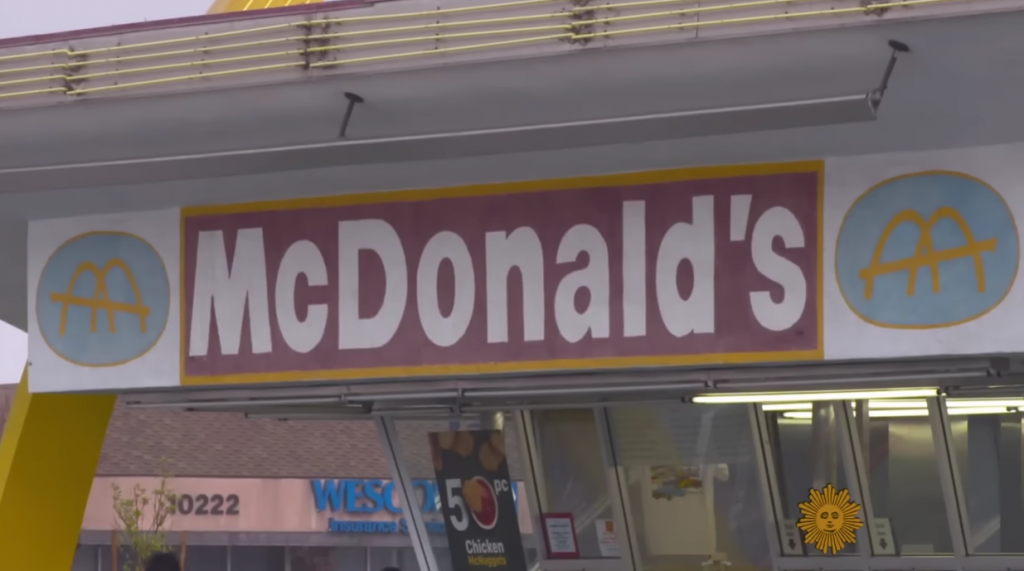
It may come as no surprise that McDonald’s still reigns supreme as the undisputed fast food king of the world. The restaurant’s legacy began back in the mid-1950s when Ray Kroc approached two brothers named Dick and Mac McDonald about the possibility of acquiring their hamburger franchise.
Kroc’s original vision was to open 1,000 McDonald’s locations across the United States. Little could he have guessed that today, McDonald’s would have over 36,000 locations and serve 63 million people a day.
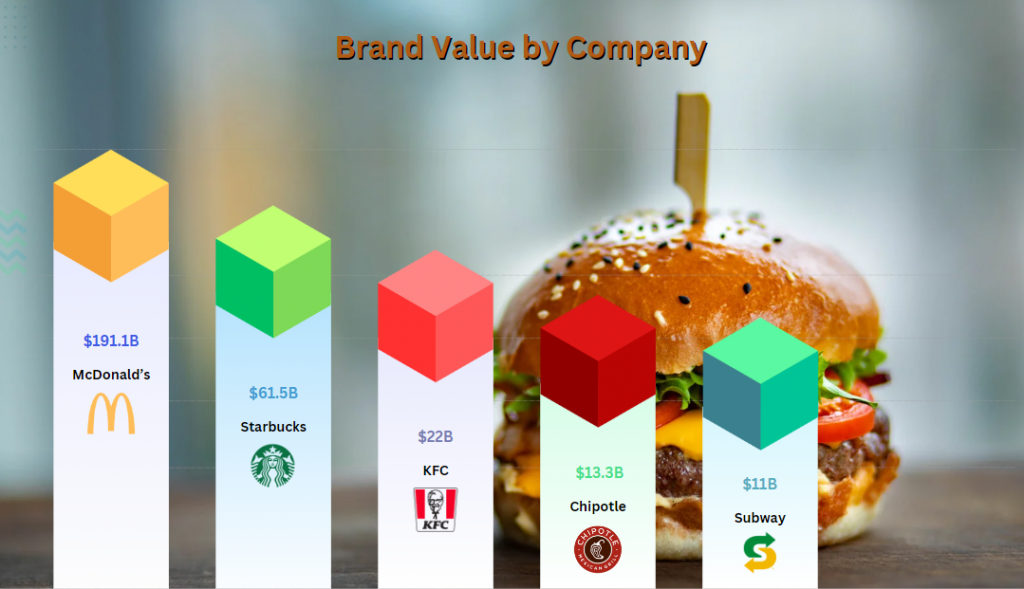
Technically, you could use a few different measurements to determine the biggest fast-food chain in the US. But for this chart, we decided to rank America’s biggest QSRs based on brand value.
Brand value is essentially a fancy term for the price a company could expect to pull in if they decided to sell their business. It takes into account everything from a brand’s financial performance to how it ranks up against competitors.
Here’s a look at the fast-food restaurants with the highest global brand values as of 2023:
Who is bigger, McDonald's or Burger King?
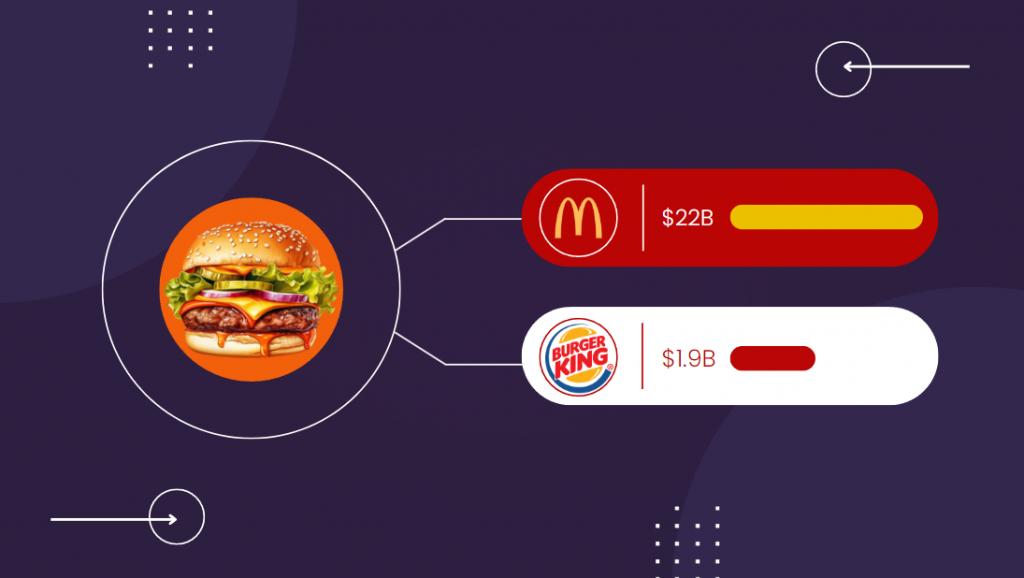
As much as we love a great flame-broiled Whopper, McDonald’s far outpaces rival Burger King in terms of sales. In terms of annual revenue, McDonald’s raked in over $22B in 2022, while Burger King trailed behind at roughly $1.9B the same year.
What is the most popular fast-food restaurant in America?
In the fast food industry, popularity doesn’t always come down to which restaurant has the most locations or even which makes the most sales. Each year, the American Customer Satisfaction Index (ACSI) conducts a survey in which customers are asked to rank their favorite restaurants on a scale of 1 – 100.
Each restaurant’s final customer satisfaction index score factors in its consumer satisfaction ratings for things like:
- Food order accuracy
- Mobile app and website performance
- Menu variety and food quality
- Speed of delivery
- Quality of staff
In the most recent survey, Chick-fil-A topped the charts with an overall customer satisfaction index score of 85.

While Chick-fil-A may not be as big as fast food behemoth McDonald’s, the restaurant reported serving over 2 billion guests and selling 527 million chicken sandwiches in 2022 alone. But it’s likely that Chick-fil-A’s industry-leading social responsibility commitments also played a key role in capturing the hearts of so many chicken sandwich lovers.
The company’s latest global impact report reveals the many ways the fast food chain actively lives up to its legacy of kindness and community giving. Just a few of Chick-fil-A’s community initiatives have included:
- Donating over $24M in scholarships to help 12,700 employees pursue higher education
- Donating $740K in grants to employees experiencing times of need
- Investing $5M in nonprofit community organizations
- Donating $3.5M to provide over 17M meals to communities combating hunger
What percentage of Americans eat fast food?
At this point, we all know that fast food tends to be high in calories and low in food quality. But it’s just so…well, fast. Rare is the American who never succumbs to the urge to grab a quick bite at a reasonable price.
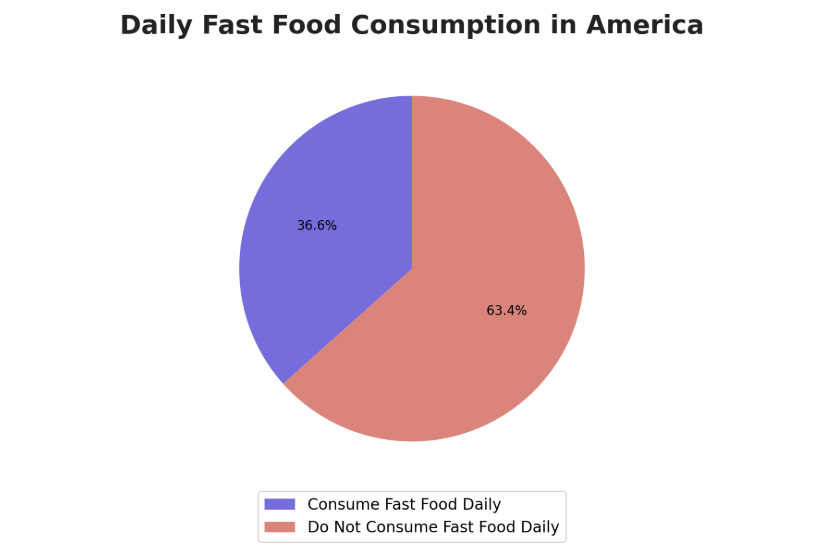
But have you ever wondered what percentage of Americans eat fast food on any given day? A few years ago, the Centers for Disease Control and Prevention (CDC) conducted a National Health and Nutrition Examination Survey to find out.
The survey revealed that on any given day, the average rate of fast food consumption in US adults was 36.6%. To put it in plain English, each and every day, over a third of the country consumes fast food of some sort.
But the CDC didn’t stop their investigation there. They went on to highlight which groups are guilty of the most fast food consumption on a regular basis.
Who consumes the most fast food?
The CDC’s National Health and Nutrition Examination Survey delved into the demographics of participants in search of any notable patterns. Here’s a look at various groups stacked up in terms of fast food consumption.
Fast-food consumption in US consumers by age
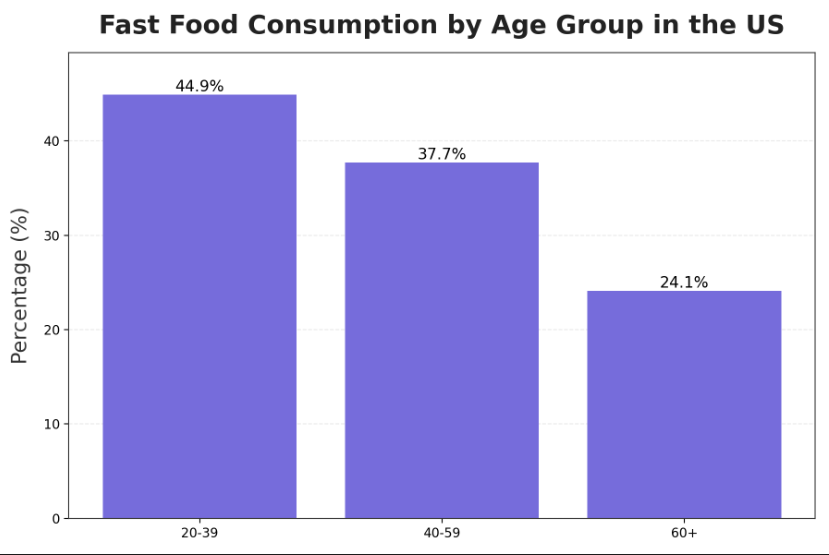
The study revealed that while 36.6% of Americans eat fast food on a given day, U.S. consumers do curb their drive-thru cravings with age. Nearly 45% of adults between the ages of 20–39 identified as fast food connoisseurs, but percentage levels declined steadily among older age groups.
Only 37.7% of adults between the ages of 40–59 and just over 24% of adults aged 60 and over reported including fast food in their diets. Men between the ages of 20-39 had the highest percentage (46.5%) of any group.
Fast-food consumption in US consumers by gender
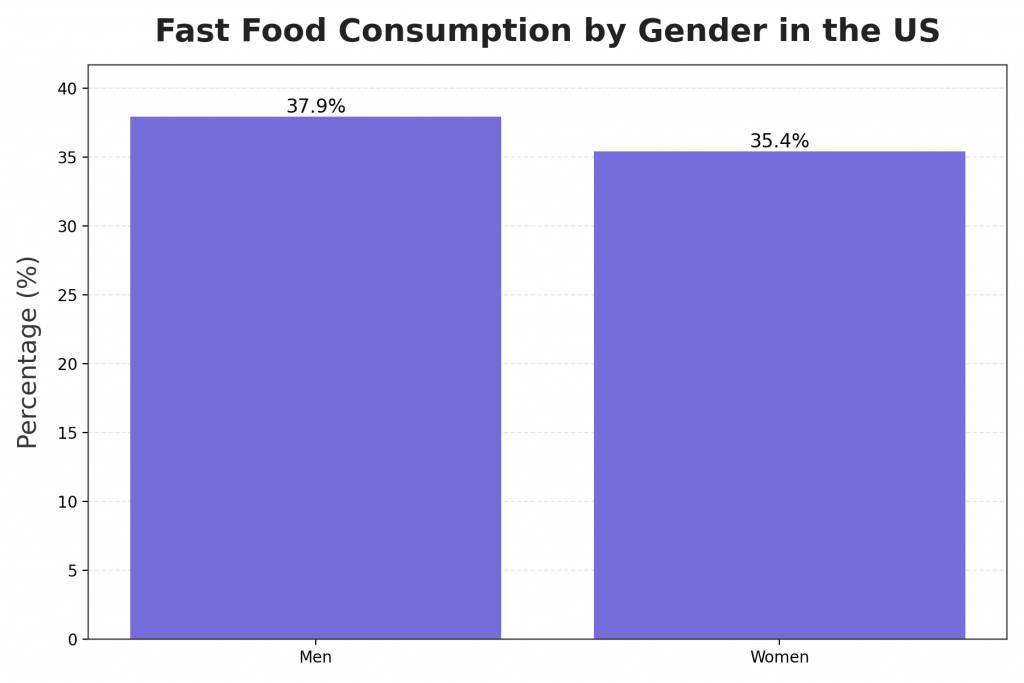
While there wasn’t a huge difference between the percentages of men vs. women who ate fast food, the survey did reveal that men tend to indulge slightly more often. Nearly 38% of the men vs. 35.4% of women surveyed admitted to hitting the drive-thru on a regular basis.
In all fairness, however, the researchers found that while men were more likely to turn to fast food for lunch, women were more likely to eat it as a snack.
Fast-food consumption in US consumers by race
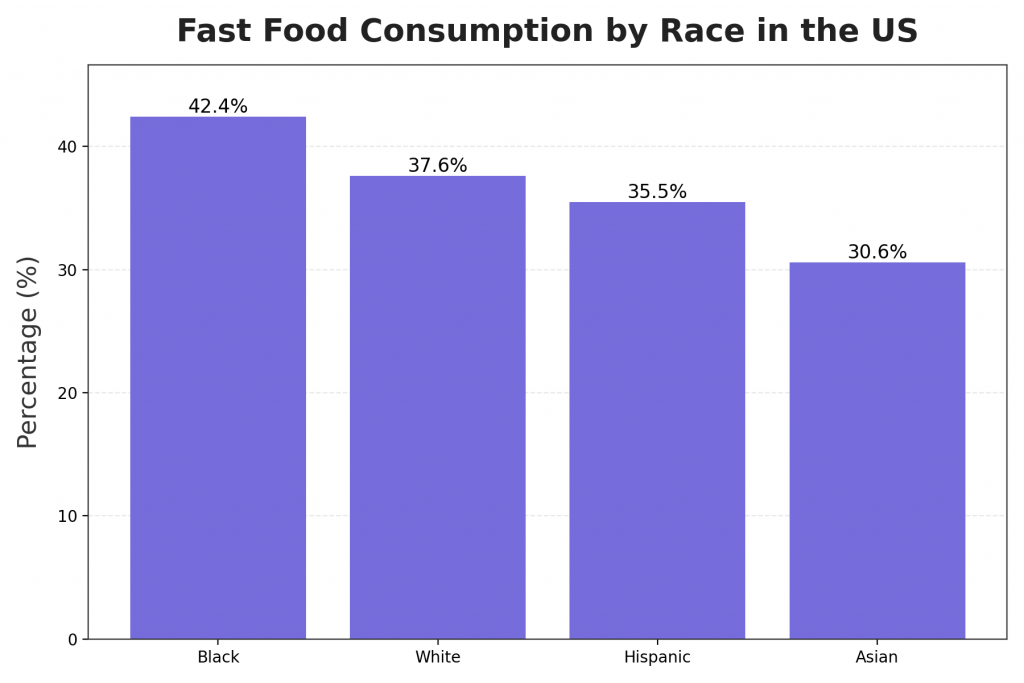
The study then attempted to identify whether certain races were more prone to fast food consumption than others.
The highest percentages of fast food fans were revealed among Black (42.4%) and White (37.6%) adults. Hispanic adults ranked third at 35.5%, while Asian adults ranked the lowest at 30.6%.
Food-food consumption in US consumers by income
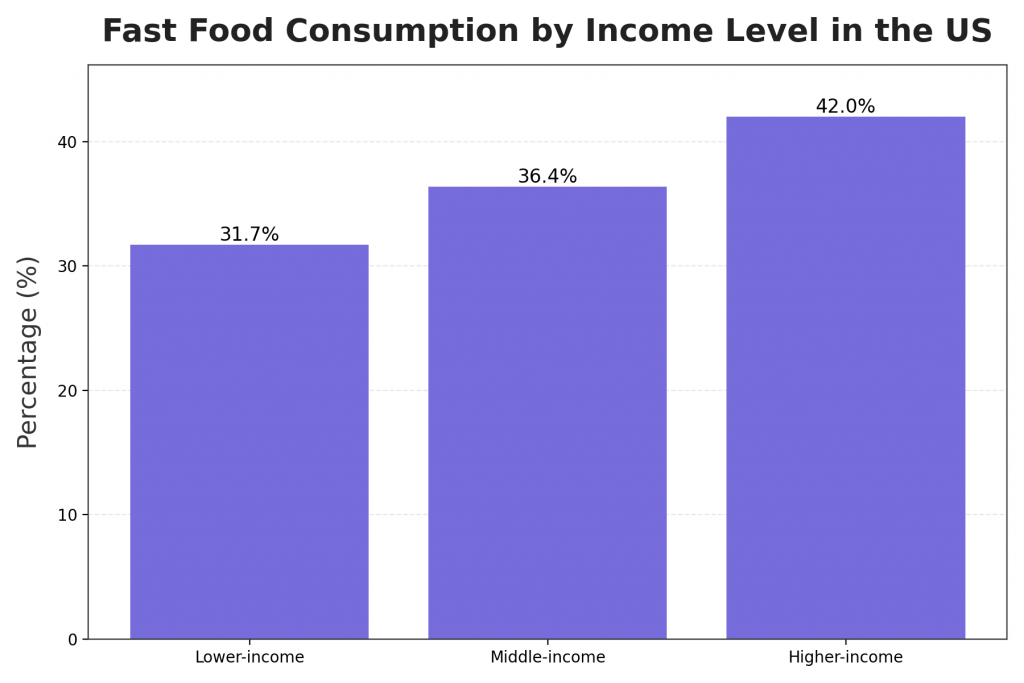
Last but not least, the survey decided to break down fast food consumption in US consumers on a given day by income level. The researchers found that the percentage of adults who consumed fast food increased along with average family income.
Among higher-income adults, 42% of survey participants identified as fast food customers. The numbers dropped to 36.4% among middle-income adults and 31.7% of lower-income adults.
How much has fast food consumption increased?
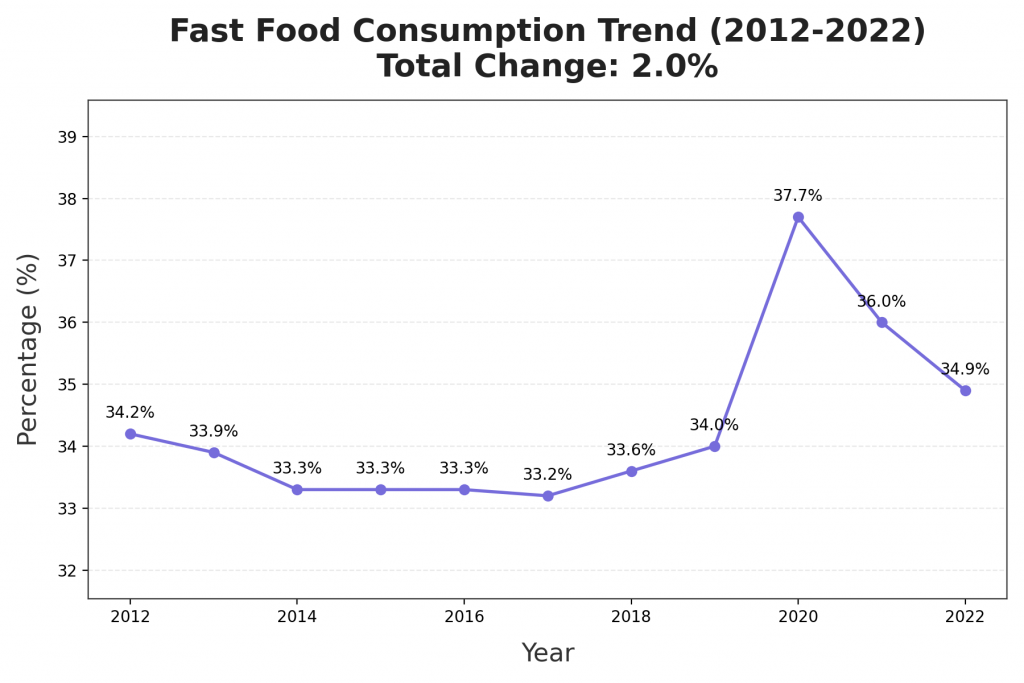
In its Food Expenditure Series, the USDA Economic Research Service tracks which options consumers are most likely to choose when dining out. For instance, what percentage of people visit fast-food restaurants as opposed to full-service or other dining venues?
Overall, their findings are pretty closely aligned with those revealed in the CDC’s study. Throughout the past decade, Americans have tended to turn to fast food around 33-34% of the time, with notably large spikes during the COVID-19 pandemic.
Which US state has the most fast food chains?
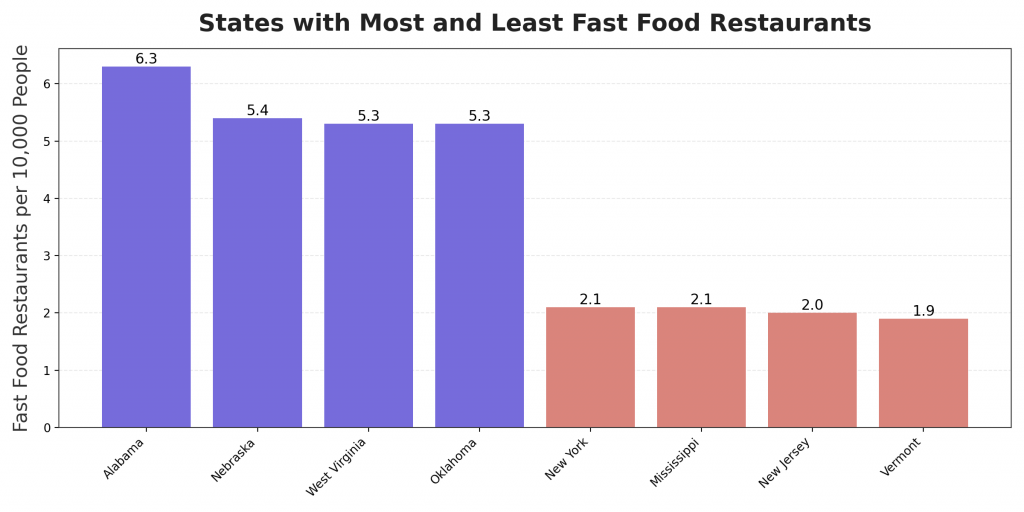
Ever wonder which states have more fast food joints than others? Recently, a company called Betsperts turned to research from Data Infiniti to find out.
By cross-referencing how many fast-food restaurants each state had per 10,000 people, the researchers were able to reveal where you’ll find the most (and least) fast-food chains. Check out the results to see if your state made either of the lists.
The researchers revealed Alabama to be the fast-food capital of the US, as the state boasts over 6.3 fast-food locations per 10K residents. They also discovered that Chick-fil-A was the most popular fast food restaurant among Alabama residents, with Starbucks and McDonald’s trailing close behind.
Nebraska, where the study revealed that McDonald’s was the preferred chain) came in second with 5.4 fast-food restaurants per 10,000 people. West Virginia and Oklahoma tied for third place, each with 5.3 fast-food restaurants per 10,000 people.
If you’re looking to avoid fast-food temptation, on the other hand, then New England may be the region for you. Vermont topped the list of the least fast-food friendly states, with just 1.9 fast-food restaurants per 10,000 residents - over three times fewer than Alabama.
New Jersey came in second with 2 fast-food restaurants per 10,000 people, while Mississippi and New York tied for third. While the third-place contestants may have little else in common, each only offers 2.1 fast-food restaurants per 10,000 residents.
Which states have the most McDonald's?
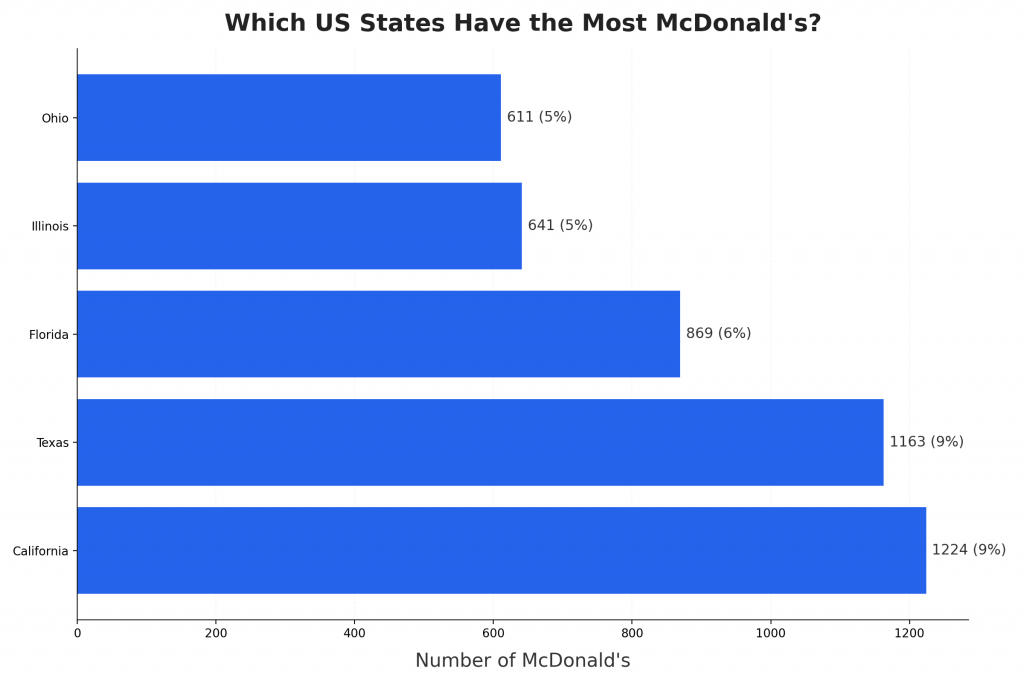
While McDonald’s has over 36,000 locations all over the world, only around 14,300 locations are located in the United States. While the exact number of locations in each state is constantly evolving, data from ScrapeHero reveals that some states have more golden arches than others.
According to ScrapeHero’s most recent info, roughly 34% of McDonald’s restaurants are located in the five states with the highest numbers of locations. California, which boasts 1,224 McDonald’s, and Texas, which has 1,163, collectively account for 18% of McDonald’s restaurants across the US.
Florida comes in third with 869 locations, which makes up about 6% of US McDonald’s locations. Illinois and Ohio are each home to around 5% of the country’s US franchises, with 641 and 611 McDonald’s restaurants respectively.
What US city has the most fast food restaurants?
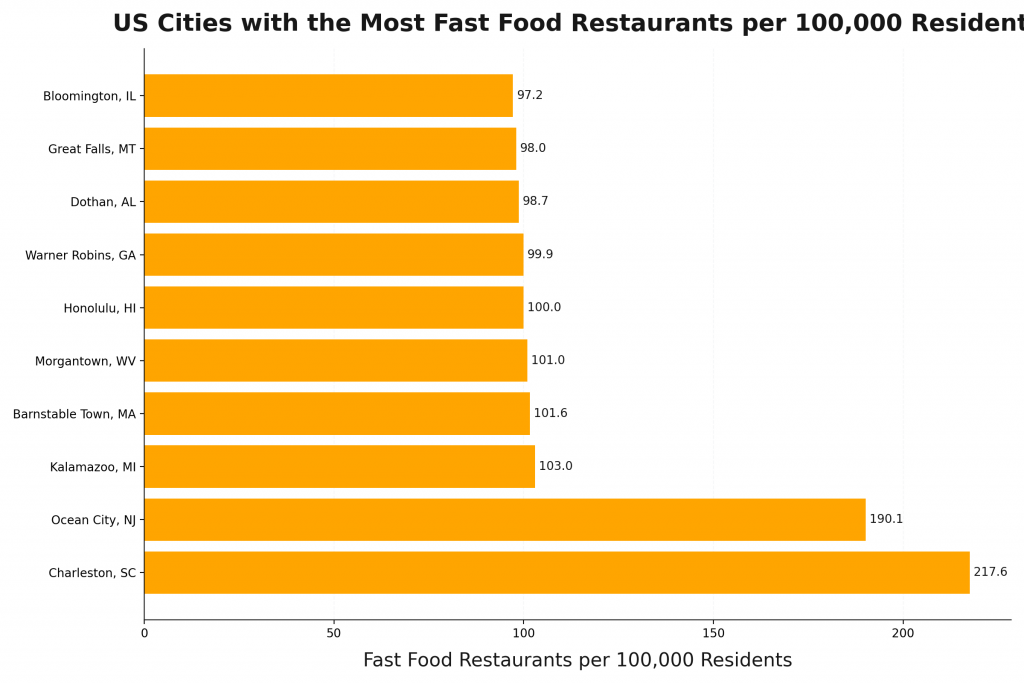
The fact that some states are low on fast food restaurants doesn’t always keep fast food havens from popping up in their cities. A recent report by CBS revealed the US cities with the most restaurants per capita.
The Charleston, SC metro area ranked as the fast food capital of the US, with Ocean City, NJ, and Kalamazoo, MI trailing in second and third. Check out the top ten US cities where you’ll have no problem finding fast and friendly drive-thru service.
Conclusion
According to information from IBIS World, the fast food consumption in US restaurants alone carved out a market size of $387.5bn in 2023. Between 2018 and 2023, the industry experienced a steady 3.4% average growth, with no plans of slowing down any time soon.
We hope you enjoyed this fun trek through the world of fast food consumption in the US! It’ll be interesting to watch how the industry continues to evolve in the coming years, as restaurant owners adapt to ever-shifting customer preferences.